Hello.
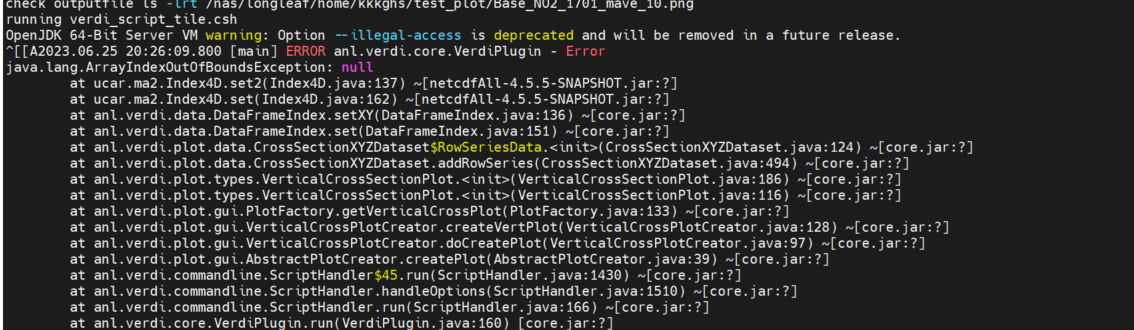
I want to draw cross-section plots with the command. (-verticalCrossPlot X|Y <row/column> (NEW))
But I am confused about using it.
Can you give me any example of a cross-section plot?
[-verticalCrossPlot X|Y <row/column> (NEW)] creates a vertical cross-section plot. You indicate whether this will be an x or y cross-section plot and what row or column to use as the base.
How can I use subdomain for corssplot? [-subDomain ] sets the VERDI domain matching the currently selected dataset to the bounding box specified by its arguments. The currently selected dataset is the most recently added dataset. It is often handy to type -subdomain commands into VERDI’s standard input if you are trying to select a very precise subdomain (such as that needed for a vertical cross-section plot).
I tried to use with the same command that I used for tile plot.