Hello,
I am plotting soccerplot from AMETv1.4. I can successfully plot it for single species. But when I compare the soccer plot output for the NMB and NME, results looks different. Here is my soccerplot
Can you provide the output from the stats_plot_leaflet script? I just did a test with some of my own data and the values from the stats_plot_leaflet script matched the Soccergoal plot. We should be able to figure out why things are different. Thanks.
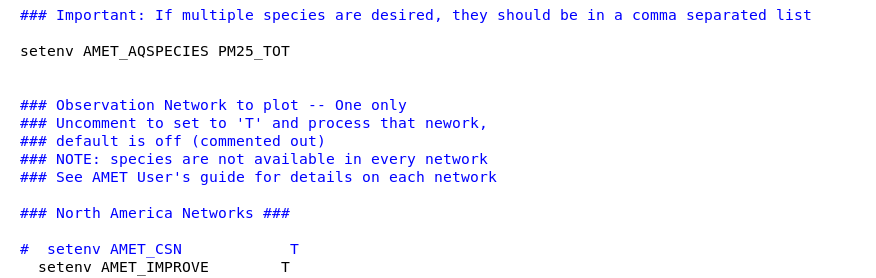
I also think you need to put the AMET_AQSPECIES variable in quotes.
setenv AMET_AQSPECIES “PM25_TOT, SO4,OC”
See if that solves that problem.
##################################
Sorry, you should not put the species in quotes. Can you provide a log file for the soccergoal plot where you attempt to plot multiple species? That should shed some light on what is happening. Thanks.
Wyat
########################
Now I recall the issue with the soccerplot. There is an error in the AQ_Soccerplot.R script. Please change line 76 in the $ametbase/R_analysis_code/AQ_Soccerplot.R script from:
l ← 10
to
l ← 9
That should fix the error you are having with the soccerplot script. Let me know if you have any questions about making that change.
Hi @wyat.appel
Thank you so much for the response. Changing l ← 10 to l ← 9 solves the both issues. Now, I am getting same results as stats_plot_leaflet and can plot multiple species at a same using comma.
I have one more question: In soccerplot I have pollutant labels legends are in grey . How do I change these into colors, lets say red, gree, yellow, purple etc.?
You can change the color by changing the “plot_colors” variable in the all_scripts.input file, the default of which is found in $ametbase/scripts_analysis/aqExample/input_files.
Note that each network gets it’s own color. So, you can’t change the color of each symbol to be different for the same network. The script was designed to facilitate looking at multiple species and networks at the same time, so I gave the species different symbols and the networks different colors. But you can change the color from grey using the plot_colors varaible.