Hi everyone,
I have recently been using CMAQv5.4. My simulation domain is located in Asia. I found that the results of CMAQ did not simulate the increase in PM concentration caused by sandstorms.
I attempted to set the parameter sf_Surface_physics in the namelist of WRF to PX LSM (7) and set the parameter CTM-WB_DUST in the CMAQ script to Y to use online wind erosion dust emissions. However, the simulation results are not significantly different from before and still cannot simulate the increase in PM concentration caused by sandstorms.
How can I set CMAQ parameters to simulate the increase in PM concentration caused by sandstorms?
To investigate your issue, I would recommend turning on the windblown dust emission diagnostic output file by setting CTM_DUSTEM_DIAG to TRUE in the run script. Does the timing and location of the emissions in that file match your expectations of the sandstorm you are trying to simulate? You mention that the runs with and without windblown dust are not significantly different from each other - how large at the PM concentration differences?
Thank you very much for your reply.
According to your suggestion, I set CTM_SUSTEM-DIAG to TRUE in the script and retested the model. I checked the data of the windblown dust emissions diagnostic file at the corresponding time based on the monitored PM high value moments. Only sporadic areas were found to have emissions, and the emissions were very low (the highest values were only around 10^(-7) g/m^3/s). This situation is inconsistent with the high PM concentration values monitored in larger areas. In addition, the simulation results did not reflect the subsequent transportation process of dust.
I also compared the concentration changes of PM10 when the parameter CTM-WB_DUST was turned on and off. The maximum increase in PM10 concentration by opening this parameter is only about 10 μg/m^3.
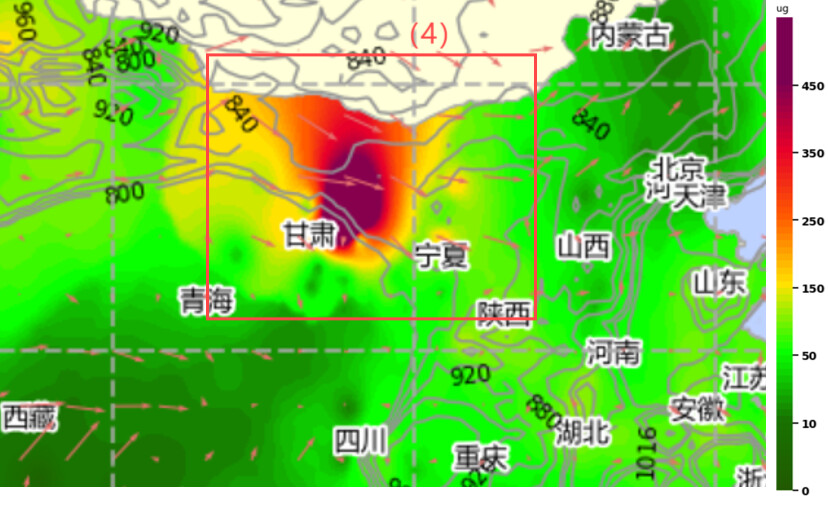
The following are the simulation results and monitoring results related graphs (the data in these graphs correspond to the same time).
(1) Open the parameter CTM-WB_DUST, the concentration map of PM10;
(2) Close the parameter CTM-WB_DUST, the concentration map of PM10;
(3) Open the parameter CTM-WB_DUST, the emission map in windblown dust emissions diagnostic file;
(4) Interpolation plot of PM10 monitoring concentration;
Thank you for posting these images. Based on a quick comparison to PMCOARSE_SOIL emission flux values in a few windblown dust diagnostic files from our own projects, the values you show in your third map indeed are 2-3 orders of magnitude lower than what I see in our files during some dust events.
To diagnose why your emissions are lower than expected, you need to work your way through the other variables in the diagnostic file (e.g. fractional coverage of the different erodible land use types) and probably back to your WRF simulations. You also want to look at the code in DUST_EMIS.F and the underlying publication by Foroutan et al. (2017) to understand which different dependencies in the scheme. Which land use dataset did you use? Dust emissions are very sensitive to meteorology, land cover, and soil conditions. Meteorological factors that would suppress dust emissions in the CMAQ dust code are snow cover, rainfall, high soil moisture, and low wind speeds, so you would want to examine your WRF fields from that angle.
According to your Figures, your domain is located in Asia. How did you use the PX LSM (7) option in WRF namelist.input file? I know that the PX LSM was designed for the USA domain, as it requires some files for the WRF model to run. My domain is also located in Asia, but I couldn’t use the PX LSM option in the WRF model. I’ll be highly grateful if you can share with me how you ran the WRF model over a domain in Asia using the PX LSM. Please note that I’m using WRFv3.8, WRFv3.9.1, WRFv4.0, and WRFv4.2. In addition, I am using CMAQv5.0.2, CMAQv5.2, and CMAQv5.3.2.