Hi,
The wilting points for different soil types are shown in the Figure (from MEGSEA.EXT). I want to ask how these wilting points were determined.

The soil moisture in California in July 2021 (drought period) and July 2019 (non-drought period) are shown in the following Figure.

It can be seen that soil moisture is lower than the wilting points in central and southern California in both drought and non-drought periods.
When turning on soil moisture stress (GAMSM_YN=Y), MEGAN generated isoprene emissions are shown in the following Figure.
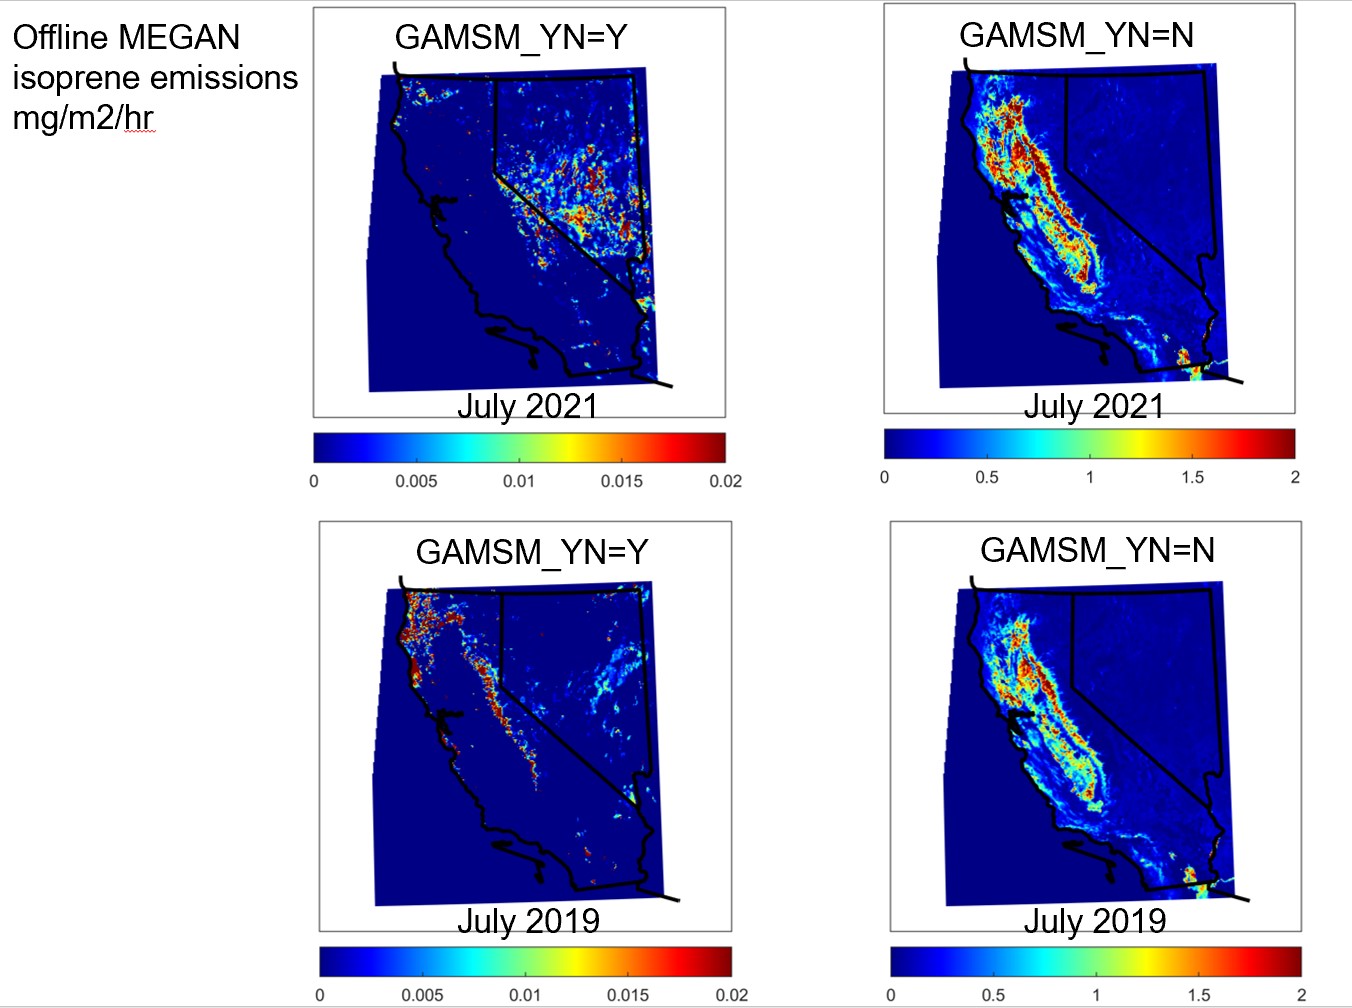
It can be seen that soil moisture stress decreased isoprene emissions a lot in both drought and non-drought periods. There is no isoprene emission in central and southern California, which is not realistic.
Therefore, I’m thinking if the wilting points in MEGANv3.2 may be not applicable to California.
The weather conditions I used as input to MEGAN are from WRF simulations, which were driven by ERA5 (ECMWF Reanalysis v5). According to Muller et al (2008), when using the ECMWF global weather model, it was necessary to use the ECMWF wilting point dataset. So I’m wondering if I should use ECMWF wilting points. But I don’t know where to get them. Or I can use Chen and Dudhia (2000) wilting points, as shown in the Figure.

Thanks,
Huazhen