Dear teachers, I simulated the concentration of ozone and PM in January with the CMAQ model. The concentration of PM2.5 extracted from the simulation results ACONC file was less than 1ug/m3, but the simulated value of ozone was within the normal range. Why does PM cause so much error?
I use CMAQv5.2, the mechanism used is saprc07tc_ae6_aq.
run_cctm.csh (24.1 KB)
Attach my LOG file:run_cctm.log.txt (2.0 MB)
Hello @Bailey ,
there is too little information in your post to provide a specific answer. As noted by my colleague @cgnolte in another thread where another user reported unexpectedly lower simulation results
What is different in your case compared to others who have used CMAQ to simulate air quality in China? Are you using the same emissions data successfully used by others, or is it a new dataset you have created? If so, how was it prepared? Are you using meteorological data that have been used previously, or is this a new dataset? If so, how was it prepared? … While there are other possibilities, the problem is usually emissions.
Your log file indicates that your input files contain some emitted species that are not being used, and that there are some expected emitted species that aren’t contained in your emission files. Not all of these mismatches would be impactful, but you would want to investigate them further.
CHECKING COMPATABILITY BETWEEN INTERNAL SPECIES LIST AND EMISSIONS INPUTS
The following tables list the chemical species present
on each emission file or from each online emission source.
This is the list of species in your input files:
Gas and Aerosol Gridded Area Emissions: 66 Species
AACD ACET ACYE ALK1
ALK2 ALK3 ALK4 ALK5
ARO1 ARO2 BACL BALD
BENZ CCHO CH4 CRES
ETHE FACD GLY HCHO
IPRD ISOP MACR MEK
MEOH MGLY MVK OLE1
OLE2 PACD PRD2 RCHO
RNO3 TERP SO2 SULF
NH3 CO PMC NO
NO2 HONO PEC POC
PAL PCA PCL PFE
PH2O PK PMG PMN
PMOTHR PNA PNCOM PNH4
PNO3 PSI PSO4 PTI
SESQ HCN CH3BR CH3CL
CH3I N2O
This is the list of emitted species expected by the CCTM
The following tables list the emission surrogate species
present in each namelist or in the aerosol data table.
GC Namelist: 63 Species
NO2 NO HONO CO
SO2 SULF HCHO MEOH
AACD PACD RNO3 ACET
CRES CCHO RCHO MEK
FACD PRD2 MGLY IPRD
GLY BACL BALD MACR
MVK ACRO ETHE PRPE
13BDE ISOP APIN ACYE
BENZ TOLU MXYL OXYL
PXYL B124 ETOH ALK1
ALK2 ALK3 ALK4 ALK5
SOAALK OLE1 OLE2 ARO1
ARO2MN NAPH TERP SESQ
CL2 HCL HCHO CCHO
ACRO POC POC POC
POC POC POCAeroData Table: 22 Species
PSO4 PNO3 PCL PNH4
PNA PMG PK PCA
PEC PFE PAL PSI
PTI PMN PH2O PMOTHR
PMC POC POC POC
POC POCNR Namelist: 1 Species
NH3
This is the list of expected species not present in your input file:
The following GAS emission surrogate species are
not present from any of the Area, Point, Biogenic,
Marine Gas, or Lightning emissions sources
ACRO PRPE 13BDE APIN TOLU
MXYL OXYL PXYL B124 ETOH
SOAALK ARO2MN NAPH CL2 HCL
ACRO
And this is the list of species in your input file not used by the model:
ATTENTION: The following emission species are available
from the inputs but are not used: 8 Species
ARO2 CH4 PNCOM HCN
CH3BR CH3CL CH3I N2O
The presence of PNCOM might be relevant, though I am not familiar with saprc07tc_ae6_aq to really judge its importance.
Thank you for your recommended article, which gives me some ideas.
I combined the processed Chinese MEIC list with MEGAN’s output ncf file as the input emission source of CMAQv5.2 ( the combined emission source file LAY=1 and does not contain point source lays), so I set CTM_EMLAYS=1 in the cctm script.
I also looked at the MCIP output 3D file, which shows LAY =29, so “set NZ=29” is also mentioned in the cctm script
I wonder if this is the main reason for the underestimate of PM concentration? But my ozone levels are normal.
If your combined emissions file has only a single layer, setting CTM_EMLAYS = 1 in your run script is necessary and correct.
As far as I can tell, the set NZ=29 command is not actually used for anything in your specific run script that is based on the v52 example (it is used for run script diagnostic logging in run scripts for more recent versions of CMAQ) and would not impact any CCTM behavior. Therefore, this command is not the cause of your underpredictions.
Assigning all MEIC emissions to layer 1 rather than vertically distributing them may be related to the model performance issues you are encountering. For example, in reality power plant SO2 emissions may occur several hundred meters above the ground if stack height and plume rise are taken into account, and such emissions may then undergo transport and transformation aloft to form sulfate which may subsequently mix downwards at downwind locations. Assigning all emissions to layer 1 likely would lead to very high localized SO2 concentrations and high near-source deposition, substantially reducing downwind impacts.
You did not specify where your PM underestimations occurred relative to the location of emission sources. In addition to PM and O3, you would also want to look at the spatial patterns and temporal variations of primary pollutants like CO, SO2, and NO and compare them to any available observations to better understand why your model results are not consistent with your expectations.
Dear teacher, the human source I chose in the simulation is the MEIC list of China. The MEIC list has no point source, so the point source is not considered for the time being.
As mentioned before, I merged the human source and natural source and put into CMAQv5.2, and the simulated data was shown in the figure. I sketched the spatial distribution of O3, SO2 and CO, and the simulated data was too bad. Ozone simulations show concentrations in the 65-70ug/m³ range in most areas, with low values occurring in cities such as Beijing. Compared with the observed data, most O3 concentrations in January are about 30-40ug/m³. Obviously, there is something wrong with my simulation.
My simulation was conducted in January 2020, using the combine tool to merge ACONC files and map the spatial distribution of pollutants
Sorry for asking you many times. Since I am the first person in the group to learn CMAQ, I can only post the question online for inquiry. Thanks again for your answer


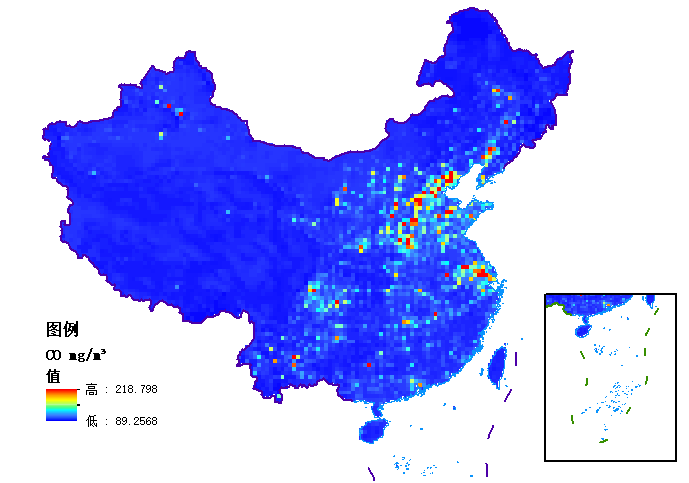
Thanks for sharing these figures. To me, the spatial patterns of the SO2 and CO concentrations looks reasonable (are the peak CO concentrations really over 200 mg/m3? That would be about 200 ppm). The ozone field for this January case essentially seems to be driven by inflow from the boundaries (how were those generated?) and then some NO titration in urban areas, with little formation.
Are these maps for a specific hour or do they represent some average conditions during January 2020?
Others with more experience simulating this region and time period can hopefully weigh in with more specific suggestions, but here are some more things to consider:
- while MEIC might not provide the location and stack parameters of specific point sources, it probably does provide emissions for different sectors. In that case, you could still distribute emissions for certain sectors (e.g. industrial processes, stationary combustion, etc.) across several model layers to reflect the fact that some of these sectors typically represent elevated emissions.
- Have you looked at diurnal variations of observed and modeled concentrations? Is model performance equally poor during day and night? Do diurnal variations in modeled PBL height look reasonable?
- Do you have datasets you could use to evaluate vertical mixing?