Hi everyone,
I’ve been looking into the Canadian nonroad sector and had a question I wanted to share in case anyone has explored this before.
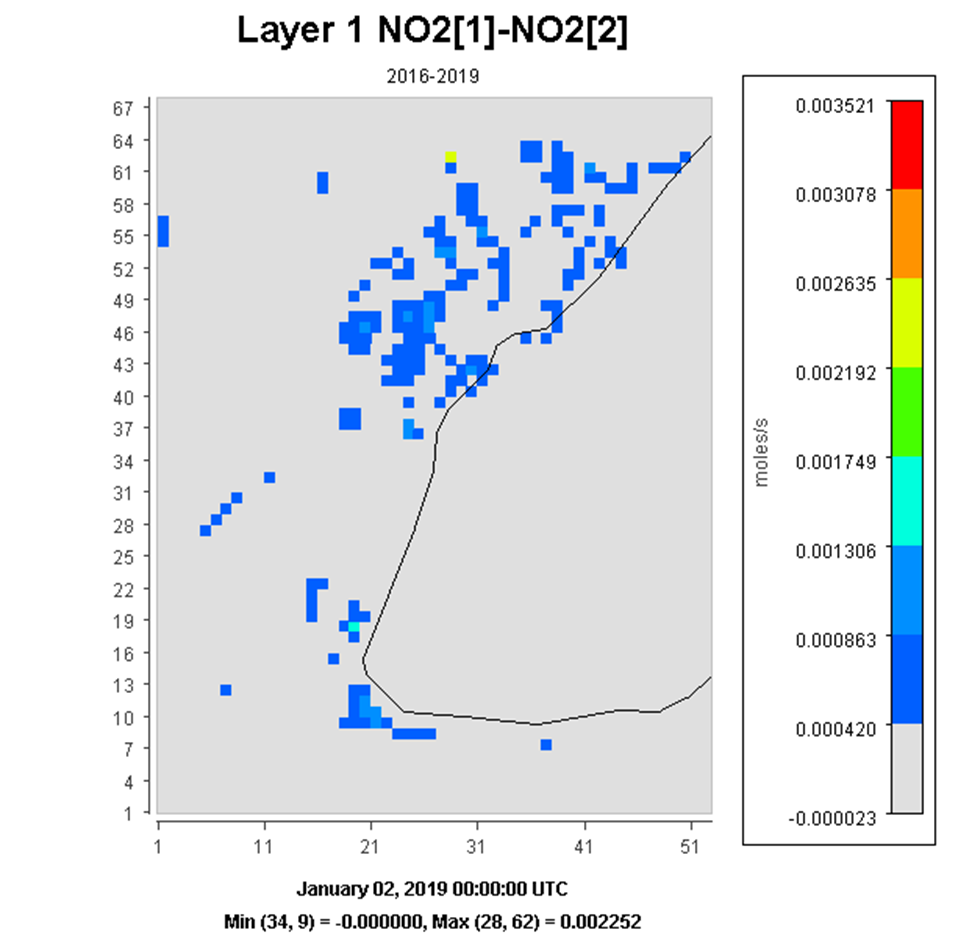
To what extent did projecting the 2016 Canadian nonroad emission inventory to 2019 using U.S. MOVES‑based trends alter the estimated NOx emissions, and how did this change translate into differences in modeled NOx concentrations across Canada in 2019 compared to a baseline using the original 2016 emissions?
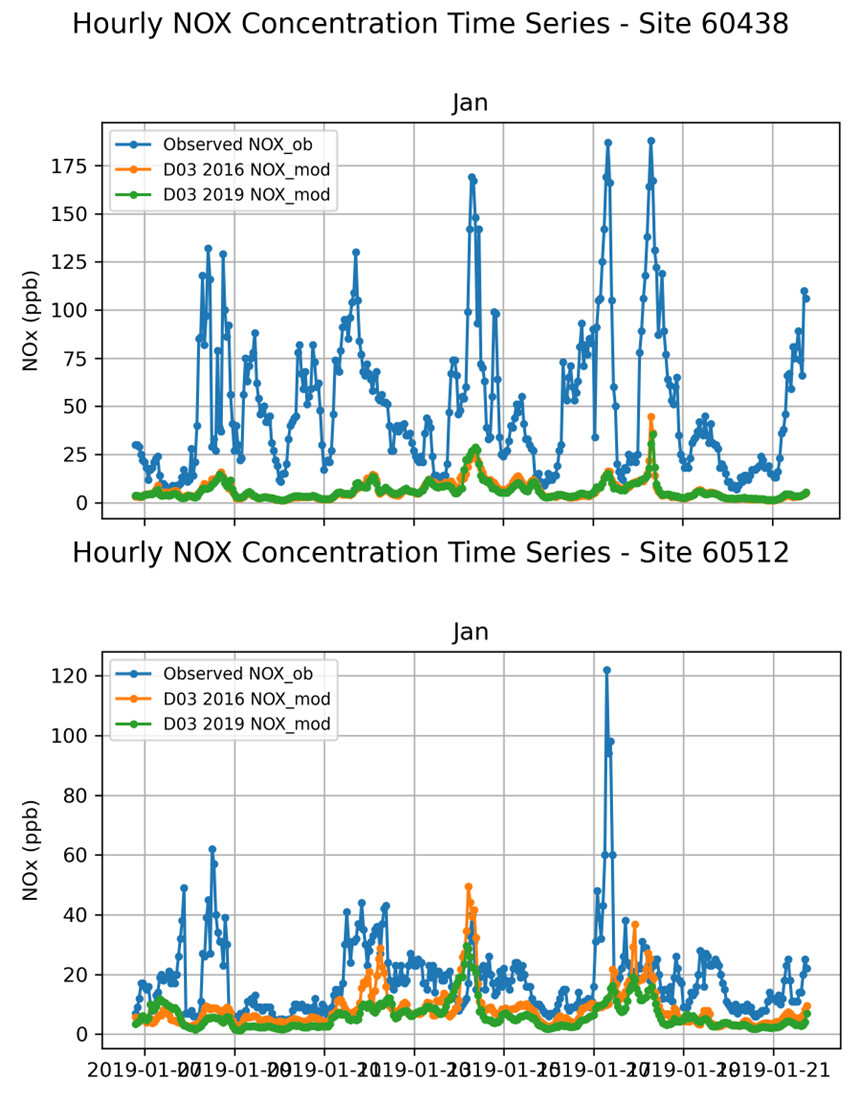
The reason I’m asking is that I’ve been noticing a significant underestimation of NOx in the Canadian domain in my modeling work. While investigating, I compared the 2016 inventory with the 2019 projected inventory and started wondering whether the application of U.S. MOVES‑based trends might be contributing to this discrepancy.
If anyone has insights, references, or experience with similar evaluations, I’d greatly appreciate your thoughts.
Thank you!
Shayamila
The warnings about control efficiency, rule penetration, and rule effectives can be ignored.
The emissions would just be taken at face value with no control applied.
Although it would be good to confirm in your SMOKE outputs that they look to be of similar magnitude to the emissions in the input inventories.
Thanks Alison for your reply. I see an increase in emissions with 2016 inventories. but the concentrations from CMAQ hasn’t really improved the NOx bias. i am still struggling figure out whats causing the NOx underestimation. I was hoping the replacing onroad/offroad inventories with 2016 version would work 
It could be that some sector(s) are missing from your simulation. I recommend reviewing all of the sectors to ensure that the emissions output for your domain match what is going in for that time. I’m wondering if there could be a units issue some how due to the magnitude of the difference.
Hi Alison,
As you suggested, I went over all my input files, and I believe I have included all the required emission sectors. I intentionally did not use the agricultural fire emissions for this domain.
Could you kindly review the list below and let me know if you think I might be missing anything?
I also checked the merging log file to make sure the sectors are merged correctly, and I verified in the CMAQ files that they are being read as expected. I’ve attached snapshots of those findings as well.
I could still be wrong — I may have overlooked something. I’m new to CMAQ and have been struggling for months to fix this issue, so any guidance would mean a lot.
My only other guess is related to biogenic emissions. I am using MEGAN and followed the provided instructions to generate the input files for CMAQ, but I am not sure if I need to change any settings within the CMAQ run script to adjust the units for that.
Attached are the outputs I obtained from the CCTM_DESID1_MIOG_v54_gcc9.2.0_2019_D03 files. Any thoughts or suggestions would be greatly appreciated.


Also, I have not included soil NO. wondering if that plays a critical role as well.
Thanks again.
Shayamila
You do have the complete sector list for Canada. Could you please describe your domain and what you are using for boundary conditions?
@willison.jeff may be able to provide more clarity on the required MEGAN settings.
Hi James,
I’m using the US1: 459×299 domain output from CMAQ to generate ICON/BCON for my 4 km domain. (This domain already exhibited significant underestimation in NOₓ, as noted here: Underestimation of NOx in Canadian Dominant Domain - #2 by foley.kristen).
For the 12 km runs, I obtained the 108k HEMI data for ICON/BCON along with all CMAQ inputs from the EQUATE project (2019 version).
Here is my domain setup. So far, I’ve only examined the 4 km and D03 (Toronto 1.33 km) outputs:
For my 4km domain, I used all the emission sectors for the US and Canada.
- AFDUST
- AIRPORTS
- CANADA_AG
- CANADA_OG2D
- CMV_C1C2
- CMV_C3
- LIVESTOCK
- NONPT
- NONROAD
- NP_OILGAS
- NP_SOLVENTS
- fertilizer
- ONROAD : This I used the AQ inventory instead moves version
- OTHAFDUST
- OTHPTDUST
- OTHAR
- ONROAD_CAN
- OTHPT
- PTAGFIRE
- PTEGU
- PTNONIPM
- PTFIRE-RX
- PTFIRE-WILD
- PTFIRE_OTHNA
- PT_OILGAS
- RAIL
- RWC
For 1.33km domain, I only used the Canadian emission sectors except PTFIRE_OTHNA. Here are the sectorsused : Onroad_can, Canada_Ag, Canada_og2d, cmv_c1c2, cmv_c3,OTHPT,OTHAFDUST,OTHPTDUST, and OTHAR
I really appreciate you taking the time to help me out.
As a side note: Are the emissions from the NEI2019 platform different from those used in the EQUATES 2019 platform?
Thanks again,
Shayamila
Do you mean you did not include soil NO in the box plots? The NO in the DESID1_MIOG files is soil NO. The values look like they might be low but could be reasonable if using YL. They would be higher if using BDSNP, but I don’t expect that to move the total NOx bias very much in this area. This is west of Erie?
Hi Jeff, What I meant was in cctm run script I did not turn on the BDSNP. Since I am not really familiar with all these mechanisms in CMAQ I was not sure if that would cause such a large difference.

Thanks,
Shayamila
This will result in soil NO estimation from the MEGAN-YL scheme, which is generally thought to be low biased but I don’t suspect that is the main issue here.
Is there a way for me to verify MEGAN inputs I have provided are correct? For your reference, I am attaching my run script and control files. wondering if there is anything I have not set up correctly in these.
CMAQ_Control_Misc.txt (8.0 KB)
CMAQ_Control_DESID_cb6r5_ae7_aq.txt (12.9 KB)
CMAQ_Control_DESID.txt (14.0 KB)
run_cctm_7day_2019_D03.csh (38.1 KB)
A quick check would be to compare the range of values for the variable EF_NO in your MEGAN_EFS file with this screenshot:
This is the emission factor for MEGAN-YL that gets multiplied by emission activity (calculated from your meteorological inputs) to calculate soil NO emissions.
Here are the EF_NO for 4km and 1.33km domains,
seems they are in the same range as the EF_NO you shared above. if this isn’t the problem. im not sure what else could it be. Thanks again for all your help.
The 2019 EQUATES platform uses many of the same inventories or methods as the 2019 EMP. There are exceptions for sources and sectors where the 2019 EMP methods are inconsistent with the other years in the EQUATES time series such as the application of projection factors for rail, rwc, etc.
Interesting. I doubled checked on where I got the smoke output for 12US1 domain and it happened to be from here https://2019platform.s3.amazonaws.com/readme.html .. so is it safe to say that all the emission data I used for all 3 domains were generated from the 2019 emission platform?